Posts

Showing posts from August, 2018

Signal news 27-8-2018

Image
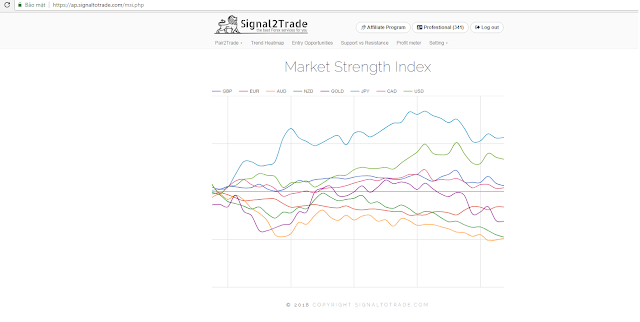
The strongest currency in day: JPY The weakest currency in day: AUD more detail market strength .... Buy signal : S&P500 , NIKKEI225, BTCUSD, BTGUSD Sell signal : AUDUSD , GBPCHF More detail about trend heat map Ps: Nikkei225 has signal with high   Reliability (82%) of the up trend. We highly recommend it as we trade, More detail entry...

the easiest way to follow the trading signal....

Image
If you have a good trading system, you just have to follow them ! you can see it in the below link! https://signaltotrade.com/ytb.html

Today I buy gold…

Image
 Today  I buy gold… I see the chance to buy gold today ( 20- August-2018) 1. I see the Big Boy ( big money) go in Gold volume and market GOLD market has bigger move than other one. Using the tool Volume analysis 2. The Big boy ( shark) money go in many time frame of GOLD: M15,M30, or D1 using tool support trader to find   Pair to trade   3. The trend GOLD is up in full M15-M30-H1-H4 And D1 was downtrend in 51 days with trusted rate down to 74% accounting the system trend heat map calculation. using the Market Trend Map . 4. Following  the entry signal. Using Entry Opportunities 5.  Set up the Stop loss and Take profit level following the Support vs Resistance levels 6. Trading like fishing… watch the rusult

Crypto-Currency started new up trend or...?

Image
What do you think about Crypto- currency trend today?  I won't talk my opinion, Sir. Market won’t care me. Our system showed that: - Bitcoin was in downtrend 15 days ( today is 18-8-2018) with -165988 pips. But Bitcoin has comed up trend in H4 timeframe for 20 H4 bar ( meaning H4= 4 hours) => Bitcoin was up for more than 3 days  Who is the strongest in Crypto currency ? The answer is: Bitcoin Who is the weakest in Crypto currency ? The answer is: Xrp Why? That is the result of our AI systems: 1. In down trend period D1, xrp was down in 31 days compared to 15 days of Bitcoin => Xrp was downed before Btc 16 days 2. In uptrend period H4, Bitcoin was up for 20 bar H4 compared to 13 in Xrp => Xrp was up after 7 h4 bar ( almost more than 1 day) ….. =>> If you want to hold 1 crypto currency to minimum risk in downtrend or quickly up in uptrend you should consider Bitcoin not xrp… For objective idea please use the system not your personal

Signal to trade... Never easier..

Image
This video will how you how to use several service of Signal2Trade to build Trend Following Strategy. 1. How to select the best forex-crypto pair to trade 2. Get direct of trade (Buy or Sel) with Trend Heatmap Service 3. Setting to get entry and timming with Entry Opportunities Service 4. Review Stoploss and Takeprofit with Support vs Resistance, Take profit like a Pro services 5. Take a coffee and .

Counter Trend Trading Setup

Image
Counter Trend Trading Setup This counter trend trading setup take advantage of   Potential Reversal   Zone . This Algorithm trading find the high probability of reverse trend so we can use it to have the entry with good risk: reward.   Potential Reversal   Zone helps trader take profit or watch the order closely if the signal appear on the time frame or bigger time frame of trade. It also helps   traders prepare for new trend and next entry. This set up content only 2 simple steps: - First step :   Opening the Potential Reversal   Zone to find the signal, we recommend to use signal of time frame H4 and D1 to trade. In this illustration, we have signal Buy for GOLD D1 after very long downtrend before. GOLD D1 has reversal signal for buy - Second step: After we have the sign of new trend, we will open Entry Opportunities to wait for the entry signal in time frame smaller: M15-M30-H1 And when the entry s

Trend Heat map

Image
Trend Heat map A brief introduction Our AI systems do analyze real time the trend in multi time frame of multi-currency and crypto-currency. In our trend heat map dashboard content all information about the trend as detail: - Multi timeframe, multi- currency-asset: You can select your watch list in our Setting section. In our trend dash board   you will see the information about trend in multi time frame from M5 to D1. - The overall information of the trends easily quickly get from the dashboard trend heat map with below   information: §   The direction of Trend: ü   uptrend with blue color ü   downtrend with red color §     The length of trend: the number before bracket in each time frame that means the length in pip of each wave since it stepped in current wave. The positive pip number is the length for uptrend, the   negative pip number is the length of downtrend. §   The old of trend: the value in the bracket () is the old trend meaning how many bar

Helping check correlation trading

Image
Helping check correlation trading The correlation is very animated in forex trading. It is easy to check what pair has high correlation with other or low relationship. There are many way to use correlation in trading but we recommend 2 significant rules: - Never buy 2 pairs have high   POSITIVE correlation to avoid double exposure. In the below table correlation you easily see AUDCHF and AUDJPY what has 84.3% positive correlation. That means if you buy or sell both AUDCHF and AUDJPY, the risk will be most double if you are wrong. - Never buy 2 pairs have high   NEGATIVE correlation to avoid unnecessary hedging. In the correlation table above, You could see AUDUSD and USDCAD has -90% negative correlation that mean if you buy AUDUSD and buy USDCAD you won’t have chance to have profit for that trade. We also highly commend trader should check the trend of these pair have high positive correlation with our Trend Heat map a

Trend Trading Setup

Image
Trend Trading Setup Buy   the Dip: We use S&P500 chart to illustrate the buy dip strategy : - Our system find out D1 started in uptrend since Jul 6 so we have market direction is uptrend -   On time frame H4 ( at least 4 times smaller) our algorithm trading find many entry as in the chart below so you won’t be missed a big trend and have a lot of chances to join more trading position during long trend to maximum the profit.   - Exit by reversal signal on H4 or D1. For exit strategy depends on the trading plan of trader like follow risk reward ratio, trend reverse… Sell the Rally This strategy is the same with buy the dip but reverse the direction. In this example of sell the rally, GOLD stepped in in downtrend since 15 Jun 2018. During this downtrend on D1, our system find our many good opportunities to open order sell. How to use our signaltotrade to follow Trend Trading setup? - First Step

4 Steps for Trading- Fishing

Image
4 Steps for Trading- Fishing You should consider trading as fishing, so when you choose the right lake having a lot of fishes it will offer more opportunities for you.  Chosen the right lake (the right currency pair for trading) you have to choose right food (right trading strategy) for fishing (trading). I introduce 4 steps for fishing- trading. 1. Step 1: “Preparing the food “ Choose your favorite trading styles: - Swing trade ( trading long term ) or Day trading ( trading short term) - Trend trading or counter trend How to setup trend trading ? Read detail… How to setup counter trend trading? Read detail… After this step you know what strategy you will use for trading. 2. Step 2: “ Finding the lake” - Long trade: you look for time frame : H4 – D1 and your order will normally take days or weeks. If trading is your part time job or you do not have time watch trading screen   all day, you should choose this